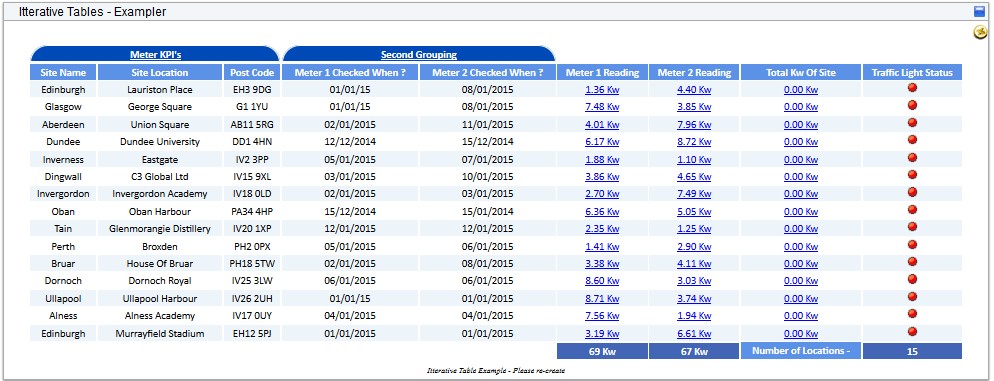
Iterative Table Example
This next section will explain the configuration behind this iterative table.
Report Table Editor
The Report Table Editor shows the configuration for the table.
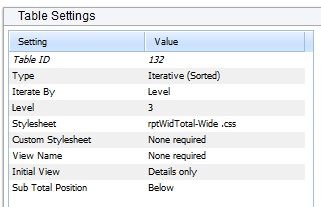
| Setting | Value and Description |
|---|---|
| Table ID | 133 - This number was generated by 4D Analytics. |
| Type | Fixed. This was selected from a drop-down list. |
| Iterate By | Level |
| Level | 3 |
| Stylesheet | This was selected from a drop-down list. |
| Custom Stylesheet | This was selected from a drop-down list. |
| View Name | None required - the view is not being used for this table. |
| Initial View | Details Only - Options as to the initial view of the table, can include grouping, subtotals, totals, and the view can be expanded or collapsed. |
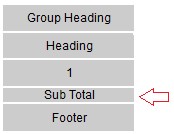
| Sub Total Position | Below - If displayed, whether the subtotal should be above or below the details or groupings. |
Table Configuration
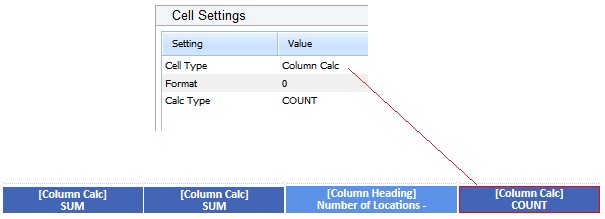
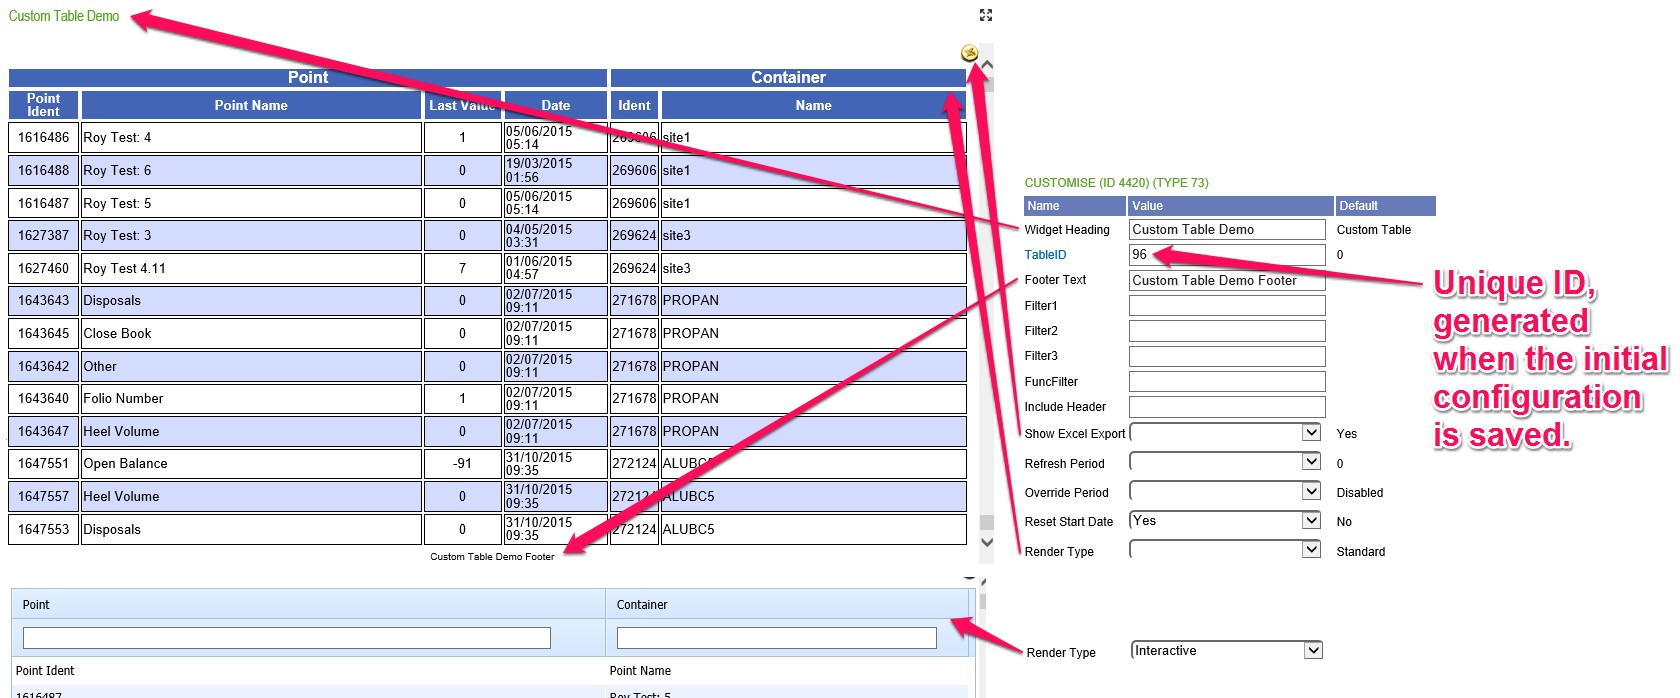
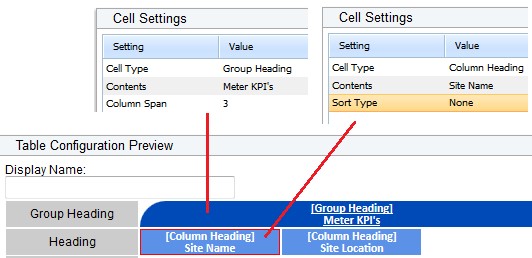
Once fields are configured, the table preview will display the field type in square brackets and what it has been set to. For example, this field is a [Column Heading] and it will display Meter 1 Reading.


Group Heading and Heading Rows

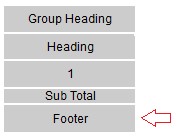
On this fixed table we have rows for Group Heading and Heading.
For the group heading row, the user can specify the number of columns the heading will span and a label for the heading. In this instance the group heading will span three rows.
For the heading row, the user can set the text to appear in the box and set whether it should be sorted. In this instance there is no sorting.
1 Row
The cells in Row 1 are a mix of property (attribute) and point values.

For more information, see Row Elements.